
The Metabolic Warning Hidden Inside Your Cholesterol Panel
Your annual bloodwork may contain an important metabolic clue that receives surprisingly little attention. It requires no specialized testing, advanced imaging, or expensive laboratory panel. The information already sits inside the standard lipid panel ordered during routine examinations. Two familiar measurements, triglycerides and HDL cholesterol, can reveal something important when examined together. Divide triglycerides by HDL cholesterol, using conventional U.S. mg/dL units, and you get the triglyceride-to-HDL ratio. Research has associated higher ratios with insulin resistance, metabolic syndrome, diabetes, and cardiovascular risk.
The significance reaches beyond predicting future disease. This ratio can expose a metabolic pattern developing while fasting glucose still appears acceptable. Diabetes rarely appears overnight, and fatty liver does not suddenly emerge from nowhere. Metabolic dysfunction can progress quietly for years while the body compensates. Insulin rises, abdominal fat accumulates, liver metabolism changes, and triglycerides begin climbing. Meanwhile, HDL often moves in the opposite direction. The resulting ratio can become one visible fingerprint of a much larger metabolic disturbance.
However, this measurement should never become another isolated number to chase. It does not independently diagnose insulin resistance, diabetes, fatty liver, or cardiovascular disease. No universally accepted treatment cutoff applies to everyone. Sex, genetics, ethnicity, medications, alcohol, diet, and existing disease can influence the ratio. Its greatest value comes from the questions it creates. Instead of asking only whether the number is high, ask what physiology caused it.
What the Triglyceride-to-HDL Ratio Actually Measures
The calculation could hardly be simpler. Divide fasting triglycerides by HDL cholesterol when both values use milligrams per deciliter. Triglycerides of 150 mg/dL and HDL of 50 mg/dL produce a ratio of 3.0. Triglycerides of 70 and HDL of 70 produce a ratio of 1.0. Those people may have very different metabolic environments despite having other laboratory values within conventional ranges.
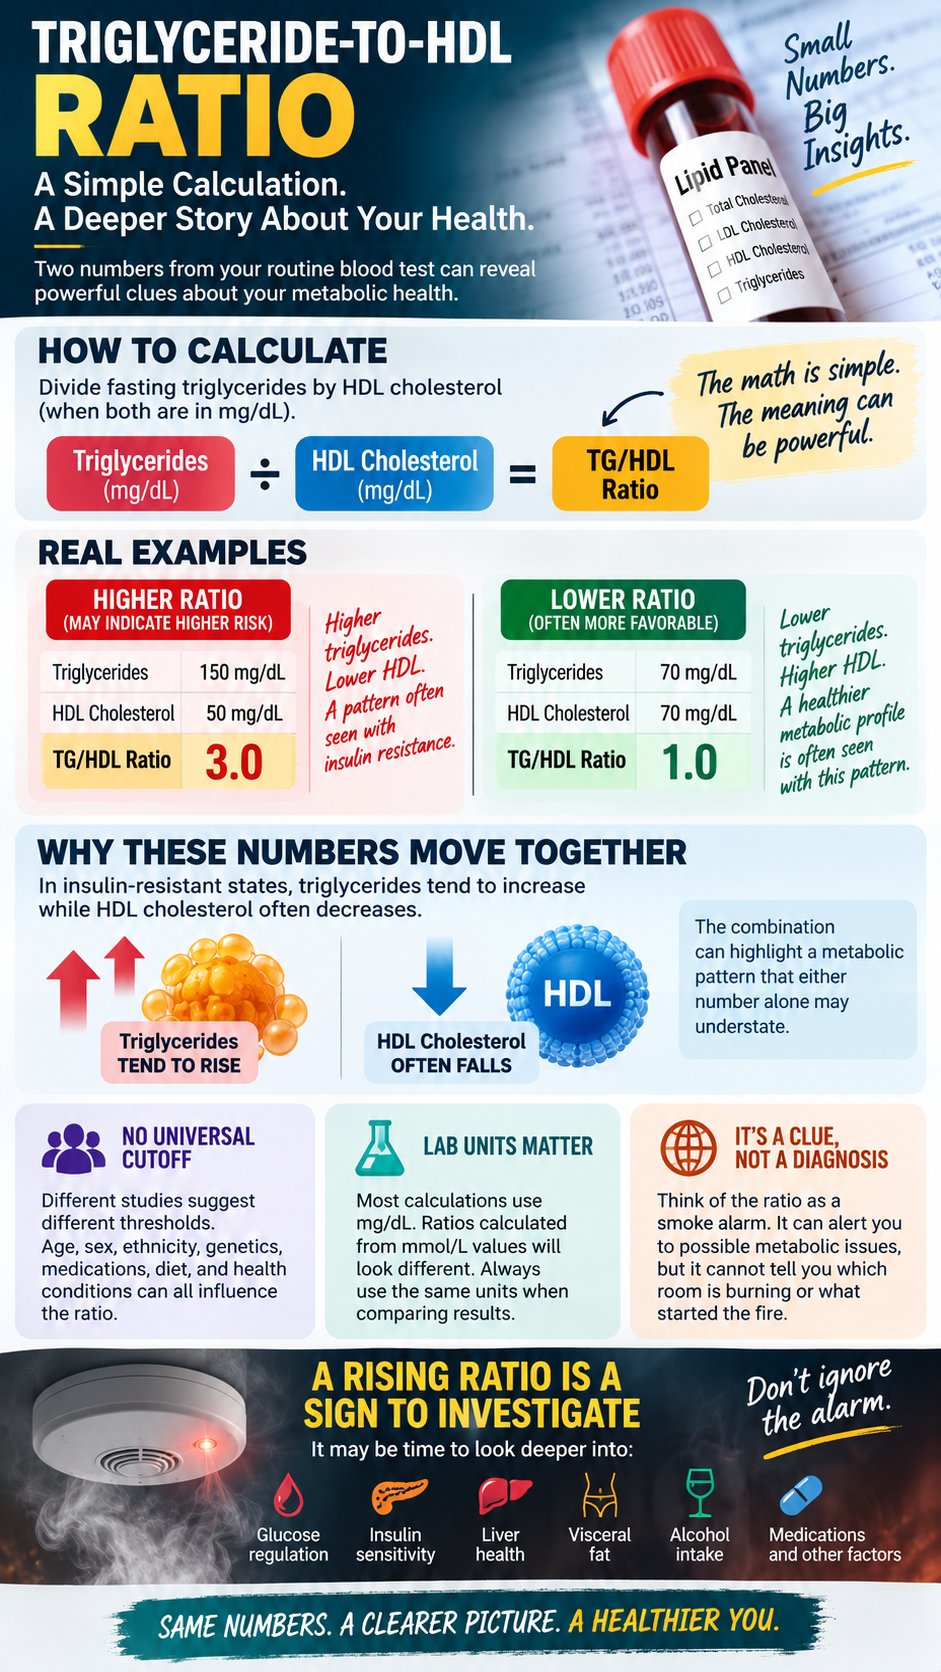
Researchers study this relationship because triglycerides and HDL frequently move in opposite directions during insulin-resistant states. Triglycerides tend to increase while HDL commonly decreases. The ratio therefore highlights a pattern that either measurement alone may understate. Different studies have proposed various thresholds, so one universal cutoff should not become metabolic law. Laboratory units also matter because ratios calculated from mmol/L values differ from those using mg/dL.
Think of the ratio as a smoke alarm rather than a final diagnosis. A smoke alarm cannot identify which room is burning or explain what started the fire. However, ignoring the alarm would make little sense. A rising ratio can justify investigating glucose regulation, insulin sensitivity, liver health, visceral fat, alcohol intake, medications, and other metabolic factors.
Triglycerides Are Not the Enemy
Triglycerides themselves are not toxins. They are essential molecules used to transport and store energy. Each triglyceride contains three fatty acids attached to glycerol. After eating, the intestine packages dietary fats into particles called chylomicrons. Between meals, adipose tissue releases stored fatty acids when energy becomes necessary.
The liver also manufactures triglycerides and packages them into very-low-density lipoproteins, commonly called VLDL. Problems arise when triglyceride production and delivery repeatedly exceed clearance and utilization. The bloodstream then begins carrying greater quantities of triglyceride-rich particles. Elevated fasting triglycerides can therefore indicate that the body’s energy-transport system is becoming overloaded.
That overload has many possible causes. Insulin resistance represents one major contributor, but alcohol, genetics, diabetes, hypothyroidism, kidney disease, medications, and chronic energy excess can also elevate triglycerides. The better question is not simply, “How do I lower triglycerides?” The more revealing question asks, “Why is my body producing or carrying so many triglycerides?”
Insulin Resistance May Be the Problem Beneath the Problem
Insulin resistance often begins long before diabetes becomes obvious. Insulin normally helps move glucose into cells while coordinating fat storage, liver metabolism, and energy availability. When muscle and other tissues become less responsive, the pancreas compensates by producing more insulin. That compensation can keep fasting glucose looking reassuring for years.
Skeletal muscle plays an enormous role because it represents a major destination for glucose after meals. When muscle responds poorly to insulin, glucose disposal becomes less efficient. The pancreas then works harder to maintain normal glucose. Sedentary behavior and declining muscle mass can further reduce the body’s capacity to handle incoming fuel.
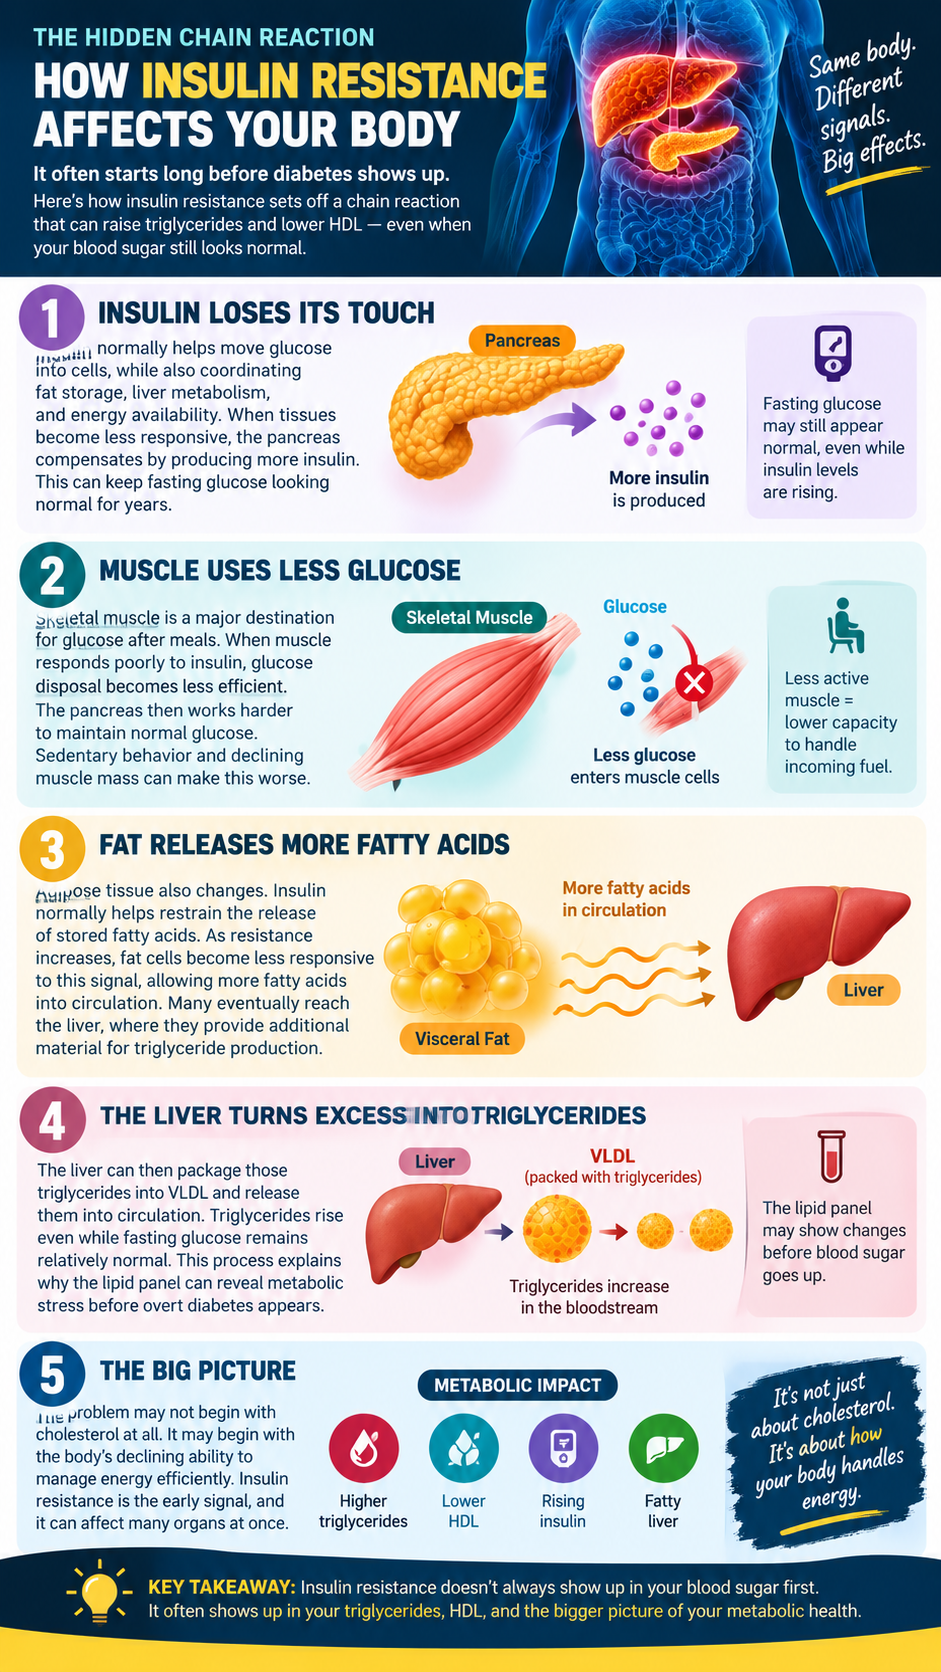
Adipose tissue changes as insulin resistance progresses. Insulin normally helps restrain the release of stored fatty acids. Resistant fat cells can become less responsive to that signal, allowing more fatty acids into circulation. Many eventually reach the liver, where they provide additional material for triglyceride production.
The liver can then package those triglycerides into VLDL and release them into circulation. Triglycerides rise even while fasting glucose remains relatively normal. This sequence explains why the lipid panel can sometimes reveal metabolic stress before overt diabetes appears. The problem may not begin with cholesterol at all. It may begin with the body’s declining ability to manage energy efficiently.
The Liver Sits at the Center of the Metabolic Traffic Jam
Few organs influence this pattern as profoundly as the liver. It stores glycogen, processes fatty acids, manufactures glucose, produces cholesterol, and assembles lipoproteins. Every day, it decides whether incoming energy should be stored, burned, transformed, or exported.
Persistent energy excess can overwhelm this system. Fat begins accumulating inside liver cells when delivery and synthesis exceed oxidation and export. This condition is now called metabolic dysfunction-associated steatotic liver disease, or MASLD. It frequently accompanies insulin resistance, abdominal obesity, elevated triglycerides, hypertension, and type 2 diabetes.
An insulin-resistant liver can create a particularly troublesome metabolic contradiction. Insulin becomes less effective at suppressing hepatic glucose production. Meanwhile, pathways supporting lipid production can remain active. The liver can therefore release excessive glucose while simultaneously producing and exporting triglycerides.
This process helps explain why fatty liver and elevated triglycerides commonly travel together. Unfortunately, routine liver enzymes do not always reveal early liver fat accumulation. ALT and AST can remain within reference ranges despite meaningful hepatic steatosis. A “normal” liver panel therefore cannot answer every question about liver metabolism.
Sugar, Refined Carbohydrates, and Excess Fuel
Diet enters the story because the liver must process whatever arrives. When energy intake repeatedly exceeds demand, excess substrate requires somewhere to go. Refined carbohydrates and added sugars can contribute heavily because they are easy to consume quickly. Sweetened beverages provide a particularly concentrated example.
Fructose deserves context because much of its initial metabolism occurs in the liver. Large amounts from sugar-sweetened beverages can contribute to hepatic lipid synthesis when consumed within chronic energy excess. That does not mean an intact apple behaves like soda. Whole fruit arrives with water, fiber, cellular structure, and greater satiety.
Carbohydrate-derived substrates can contribute to fatty-acid production through de novo lipogenesis. That process becomes especially relevant during sustained overfeeding and high refined-carbohydrate intake. Meanwhile, insulin-resistant adipose tissue may simultaneously send additional fatty acids toward the liver. The liver can become trapped between incoming fat and newly synthesized fat.
Still, blaming carbohydrates for every high ratio oversimplifies human metabolism. Alcohol, total energy intake, genetics, medications, diabetes, and endocrine disorders can create similar abnormalities. Individual responses also differ dramatically. The goal should be discovering the dominant metabolic drivers rather than forcing everyone into one explanation.
Visceral Fat Is an Active Endocrine Organ
Abdominal fat is more than stored calories. Adipose tissue releases hormones, fatty acids, cytokines, and other signaling molecules. Visceral fat surrounding internal organs behaves differently from much of the fat beneath the skin. Excess visceral adiposity strongly associates with insulin resistance, fatty liver, metabolic syndrome, and cardiovascular disease.
As visceral fat expands, its biology can change. Enlarged fat cells experience cellular stress and may attract immune cells. Inflammatory signaling increases while adiponectin, a hormone associated with insulin sensitivity, often declines. Greater quantities of fatty acids can also travel toward the liver.
A feedback loop then develops. Visceral fat contributes to insulin resistance, while insulin resistance promotes abnormal fuel handling. The liver receives additional fatty acids and exports more triglyceride-rich VLDL. Liver fat increases, metabolic flexibility deteriorates, and the pancreas must produce additional insulin.
This explains why waist circumference can reveal information the bathroom scale misses. Two people at identical weights can carry dramatically different amounts of visceral and hepatic fat. Metabolic health depends partly on where excess energy has accumulated, not simply how much someone weighs.
Why HDL Often Falls as Triglycerides Rise
HDL completes the other half of the ratio. During hypertriglyceridemia, lipoproteins exchange lipids through several metabolic pathways. HDL can become enriched with triglycerides and undergo further remodeling. Those altered HDL particles may then clear from circulation more rapidly, helping explain why HDL cholesterol often declines as triglycerides increase.
This relationship produces the characteristic pattern of insulin-resistant dyslipidemia: higher triglycerides, lower HDL, and frequently altered LDL characteristics. Smaller, denser LDL particles may become more common within this environment. However, the TG-to-HDL ratio cannot directly measure LDL particle size or number.
ApoB can add valuable information because it better reflects the number of circulating atherogenic particles. Non-HDL cholesterol provides another useful perspective. Someone can therefore have an apparently acceptable LDL cholesterol level while other markers reveal greater atherogenic particle burden. The TG-to-HDL ratio complements these measurements rather than replacing them.
Simply forcing HDL upward is not the answer either. Drug trials that raised HDL cholesterol did not consistently deliver the cardiovascular protection once expected. Low HDL often acts more like a marker of disturbed metabolism than an isolated deficiency. Correcting the environment producing the abnormal pattern matters more than manipulating the mathematical ratio.
What This Metabolic Pattern Can Do to the Body
The ratio itself does not damage the body. The metabolic processes behind an unfavorable ratio create the concern. Insulin resistance can promote rising glucose, fatty liver, hypertension, and eventually type 2 diabetes. Triglyceride-rich remnant particles can also carry cholesterol capable of contributing to atherosclerosis.
Blood vessels experience these metabolic pressures continuously. Hyperglycemia, hypertension, smoking, oxidative stress, and atherogenic lipoproteins can impair endothelial function. ApoB-containing particles can enter and become retained within susceptible areas of arterial walls. Immune activity then contributes to plaque development over time.
Severe triglyceride elevations create another danger. Levels around 500 mg/dL or higher warrant prompt medical attention because pancreatitis becomes increasingly important. Triglycerides approaching or exceeding 1,000 mg/dL can represent a particularly serious problem. At those concentrations, identifying and treating the cause becomes more urgent than calculating a ratio.
The liver, pancreas, arteries, kidneys, muscles, and brain do not operate independently. They participate in the same metabolic network. That is why metabolic dysfunction can eventually manifest as fatty liver, diabetes, vascular disease, hypertension, and other disorders. One laboratory pattern may therefore represent the visible surface of a much deeper physiological problem.
The Real Problem Is Not the Ratio
Ultimately, the triglyceride-to-HDL ratio is not the disease. A calculator does not create insulin resistance or damage an artery. The ratio reflects biological processes happening beneath the laboratory report. Chasing the number while ignoring those processes misses the entire point.
The deeper problem often involves disrupted fuel handling. Muscle becomes less responsive to insulin. Visceral fat releases more fatty acids. The liver accumulates fat and exports more triglyceride-rich particles. The pancreas compensates with additional insulin. HDL metabolism changes as triglyceride-rich lipoproteins circulate in greater quantities.
That progression can remain hidden while individual laboratory results still look relatively ordinary. This is precisely where the ratio becomes useful. It encourages us to connect measurements that are usually examined separately.
Changing the Metabolism Behind the Number
Discovering an unfavorable triglyceride-to-HDL ratio should lead to investigation, not fear. Part 1 showed how insulin resistance, visceral fat, liver metabolism, and abnormal lipid transport can converge within this simple calculation. The next question matters even more: can that metabolic environment change? In many people, the answer is yes. Metabolism continuously adapts to food, movement, sleep, body composition, alcohol exposure, hormones, and energy demand. Improving those signals can change the physiology that produced the abnormal pattern.
The mistake is treating triglycerides and HDL as two independent problems. Trying to lower one number while forcing the other upward misses their shared metabolic origins. The deeper objective is improving how the body processes and distributes energy. Better insulin sensitivity can reduce pressure on the pancreas. Less metabolic overflow can decrease liver fat and triglyceride production. Stronger skeletal muscle can create greater demand for circulating fuel. When these systems improve together, laboratory values often follow.
Restoring Metabolic Flexibility
A metabolically healthy body constantly shifts between available fuels. After eating, insulin helps direct nutrients toward immediate use and storage. Between meals, the body can draw upon stored energy. Physical activity increases fuel demand further, particularly within skeletal muscle. This ability to adapt to changing energy availability is often described as metabolic flexibility.
Insulin resistance can disturb that flexibility. Stored energy may be abundant, yet the body continues receiving more fuel than tissues require. Insulin remains elevated more frequently, adipose tissue expands, and excess fatty acids reach the liver. The liver then faces the challenge of storing, oxidizing, or exporting that energy. Increasing triglyceride-rich VLDL becomes one method of moving excess lipid elsewhere.
Improvement therefore requires changing both sides of the energy equation. Reducing unnecessary incoming energy matters, but increasing energy demand matters too. This is why nutrition and exercise work better together than either strategy works alone. The body needs fewer metabolic inputs it cannot handle and more opportunities to use what has already been stored.
Skeletal Muscle Is a Metabolic Organ
Muscle deserves far more attention in discussions about triglycerides. Skeletal muscle is not merely tissue for movement or appearance. It represents a major destination for glucose after meals and consumes substantial energy throughout the day. Muscle contractions can also increase glucose uptake through mechanisms that do not depend entirely on insulin.
Resistance exercise adds another advantage by preserving or increasing metabolically active tissue. This becomes increasingly important with age because adults commonly lose muscle unless they provide a reason to maintain it. Less muscle can mean less capacity to dispose of glucose and perform physical work. Preserving strength therefore becomes part of preserving metabolic resilience.
Movement also produces benefits before dramatic weight loss occurs. A person can improve insulin sensitivity and glucose handling while the bathroom scale changes very little. This is one reason metabolic progress should never be judged solely by body weight. Better physiology can begin before the mirror reveals it.
The Liver Can Change Too
Fatty liver should not be viewed as an irreversible metabolic sentence. Liver fat can decrease when energy balance, insulin sensitivity, body composition, alcohol exposure, and dietary quality improve. Because the liver is central to triglyceride production, these changes can have consequences throughout the lipid profile.
When less fatty acid arrives from dysfunctional adipose tissue, the liver receives less raw material for triglyceride production. Reduced energy excess can also decrease pressure to manufacture and export additional lipid. Improvements in insulin sensitivity further change how the liver manages glucose and fat. The metabolic traffic jam can begin to clear.
This is why the most useful “liver detox” often looks remarkably ordinary. It involves reducing the metabolic conditions that overloaded the liver in the first place. No juice, tea, cleanse, or supplement can substitute for that foundation. The liver already possesses sophisticated biochemical systems for processing and eliminating compounds.
Alcohol deserves special consideration because it can substantially elevate triglycerides in susceptible individuals. Someone with persistently high triglycerides may learn valuable information by reducing or eliminating alcohol and monitoring the response. The laboratory can then reveal whether alcohol was an important contributor.
Why Losing Visceral Fat Matters More Than Chasing Weight
Weight loss and metabolic healing overlap, but they are not identical. Two people can lose the same number of pounds while producing very different changes in body composition. Someone who preserves muscle while reducing abdominal fat may create a more favorable metabolic outcome than someone losing substantial lean tissue.
Visceral fat deserves particular attention because it behaves as an active endocrine tissue. Excess visceral adiposity can increase fatty-acid delivery toward the liver while participating in inflammatory and hormonal signaling. Reducing this fat can therefore improve more than appearance. It can alter the metabolic conversation between adipose tissue, liver, muscle, and pancreas.
Waist circumference provides a simple way to follow this process at home. It does not directly measure visceral fat, but changes can provide useful information when measurements remain consistent. Combine waist trends with strength, energy, blood pressure, and laboratory results. Those markers tell a richer story than scale weight alone.
What You Can Start Doing at Home
Practical change does not require turning life into a laboratory. Begin with the largest sources of metabolic overload. Remove sugar-sweetened beverages and substantially reduce refined, ultra-processed foods. Build meals around minimally processed ingredients with adequate protein and appropriate whole-food fats. Include fiber-rich foods according to individual tolerance and metabolic needs.
Create clearer boundaries around eating. Instead of grazing from morning until bedtime, establish defined meals and reduce unnecessary nighttime snacking. A reasonable overnight period without food gives the body time without continual incoming calories. Longer fasting is not automatically better. Anyone using insulin or glucose-lowering medication should seek individualized guidance before substantially changing meal timing.

Use muscle every day. Walking for approximately ten minutes after meals provides an easy starting point. Add resistance training two or three times weekly according to physical ability. Weights, resistance bands, machines, and bodyweight movements can all work. The objective is creating metabolically active muscle, not becoming a competitive athlete.
Protect sleep with the same seriousness given to nutrition. Aim for a consistent schedule and sufficient sleep whenever possible. Persistent snoring, witnessed breathing pauses, morning headaches, or severe daytime fatigue deserve evaluation for sleep apnea. Poor sleep can make insulin resistance, hunger, blood pressure, and weight management harder.
Finally, consider removing alcohol when triglycerides remain elevated. Measure waist circumference periodically rather than obsessively. Give these habits enough time to become consistent before deciding they failed. The objective is not a temporary metabolic challenge. It is building an environment the body can sustain.
Retest: Make the Body Prove the Strategy Worked
Lifestyle changes should eventually produce measurable evidence. Feeling better matters, but objective testing reveals whether internal physiology has changed. Repeat triglycerides and HDL under reasonably comparable conditions. Fasting glucose, A1c, blood pressure, liver markers, and waist circumference can provide additional context.
ApoB and non-HDL cholesterol may sharpen cardiovascular assessment because an improved TG-to-HDL ratio does not guarantee low atherosclerotic risk. Someone can have favorable triglycerides and HDL while still carrying an excessive number of ApoB-containing particles. Cardiovascular prevention requires looking beyond one ratio.
Persistent abnormalities also deserve investigation rather than frustration. Hypothyroidism, uncontrolled diabetes, kidney disease, medications, genetics, alcohol, and inherited lipid disorders can influence triglycerides. Lifestyle remains foundational, but lifestyle cannot explain every abnormal laboratory result.
Very high triglycerides require particular caution. Levels around 500 mg/dL or higher warrant prompt professional evaluation because pancreatitis risk becomes increasingly relevant. Values approaching or exceeding 1,000 mg/dL deserve urgent attention. At that point, home strategies alone are not an appropriate response.
Stop Chasing Numbers and Start Changing Physiology
The triglyceride-to-HDL ratio becomes most useful when it changes the question. Instead of asking, “How can I make this number lower?” ask, “What caused my body to produce this number?” That question moves the investigation from the laboratory report toward liver metabolism, insulin sensitivity, visceral fat, muscle, sleep, food, alcohol, and daily activity.
Your next lipid panel begins long before the needle enters your arm. It begins during ordinary evenings when you decide whether to keep eating. It continues during meals that either overload or nourish the body. It changes when muscles contract instead of remaining sedentary. Sleep, alcohol, waist circumference, and repeated daily choices continue writing the metabolic story.
One improved laboratory result should never become the finish line. Likewise, one abnormal result should never become a life sentence. Bloodwork is a snapshot of biology operating under current conditions. Change enough of those conditions, and biology often changes with them.
So remember this when you see the triglyceride-to-HDL ratio on your next laboratory report: the ratio is the dashboard light, not the broken engine. Do not spend years staring at the warning light while ignoring what lies beneath the hood.
Find what turned it on. Change what is driving the dysfunction. Measure again.
Because the ultimate goal is not simply better numbers.
It is building a healthier body that has a reason to produce them.