
THE CARDIOVASCULAR RISK HIDING BEHIND LDL CHOLESTEROL
For more than half a century, cholesterol testing has shaped the public conversation about heart disease. Millions know their total cholesterol and LDL cholesterol numbers by memory. Yet far fewer understand what those numbers actually measure. LDL cholesterol does not count the particles traveling through your bloodstream. Instead, it estimates the cholesterol carried inside a particular class of lipoprotein particles. That distinction sounds technical, but it can dramatically change cardiovascular risk assessment. A person can carry an acceptable amount of LDL cholesterol while having too many atherogenic particles. Another person may carry more cholesterol inside fewer particles. Those two situations can produce similar LDL-C results while creating different biological conditions inside the arteries.
Apolipoprotein B, commonly called ApoB, helps expose that difference. Each major atherogenic lipoprotein particle carries one ApoB molecule. Therefore, ApoB provides an approximation of how many potentially atherogenic particles circulate through the bloodstream. Those particles include LDL, IDL, VLDL remnants, and lipoprotein(a). Modern cardiovascular research increasingly recognizes this particle burden as an important piece of risk assessment. The 2026 ACC/AHA dyslipidemia guideline now incorporates selective ApoB testing, especially when standard cholesterol measurements may underestimate risk. This change does not make LDL cholesterol irrelevant. Instead, it reveals how much cardiovascular biology remains hidden inside a conventional lipid panel.
The Cholesterol Test Measures Cargo, Not Traffic
Imagine standing beside a highway and trying to determine traffic congestion without counting vehicles. Instead, you measure how much cargo every passing truck carries. Fifty heavily loaded trucks might carry the same cargo as one hundred lightly loaded trucks. A cargo measurement would make both highways appear identical. Yet the second highway contains twice as many vehicles. LDL cholesterol and ApoB can behave in a remarkably similar way.
Cholesterol cannot travel independently through watery blood because it does not dissolve efficiently in plasma. The body solves this problem through lipoproteins. These sophisticated particles transport cholesterol, triglycerides, phospholipids, and fat-soluble molecules between tissues. LDL-C measures cholesterol carried within LDL particles. ApoB approaches the same transportation system from another direction. Since each atherogenic particle contains one ApoB molecule, ApoB estimates the number of circulating particles. Consequently, LDL-C describes cargo while ApoB describes traffic.
This difference becomes important because arteries encounter particles rather than laboratory numbers. An LDL particle can cross the endothelial barrier and enter the arterial wall. Once there, certain particles become retained within the intima. Retention can initiate inflammatory and immune responses that contribute to atherosclerosis. Therefore, particle concentration affects how frequently arterial tissue encounters these lipoproteins. Greater particle numbers create more opportunities for entry and retention over time. Cardiovascular disease ultimately reflects cumulative biological exposure rather than one abnormal laboratory result.
ApoB Reveals What LDL Cholesterol Can Miss
LDL-C and ApoB often travel together. Someone with very high LDL cholesterol frequently has elevated ApoB as well. Problems arise when these measurements become discordant. Discordance means cholesterol concentration and particle concentration tell different stories. That pattern frequently appears with insulin resistance, elevated triglycerides, diabetes, obesity, and metabolic syndrome. In those situations, LDL particles may carry less cholesterol individually. More particles must circulate to transport a similar cholesterol load.
Consider someone with an LDL-C of 110 mg/dL. That value may appear relatively unremarkable during a routine examination. However, imagine that the same person has high ApoB, triglycerides near 220, abdominal obesity, and elevated fasting insulin. Their LDL-C measurement does not fully describe the circulating particle burden. Numerous cholesterol-depleted particles may be moving through the vascular system. The apparent reassurance created by LDL-C could therefore conceal an unfavorable metabolic pattern.
Research examining discordance has repeatedly strengthened the case for ApoB. When LDL-C and ApoB disagree, cardiovascular outcomes often track more closely with ApoB. That observation makes biological sense because ApoB reflects particle concentration. Still, ApoB should not become another isolated number worshipped without context. It tells us something important about the bloodstream. It does not explain what created that environment.
That question takes us deeper.
The Real Problem Begins Before ApoB Becomes Elevated
ApoB does not mysteriously rise because the body suddenly decides to manufacture dangerous cholesterol. Lipoprotein metabolism connects closely with liver function, insulin signaling, adipose tissue, genetics, thyroid physiology, diet, and energy balance. Understanding these relationships moves the conversation upstream. Instead of asking only how to lower ApoB, we can investigate what increased atherogenic particle production or reduced particle clearance.
Insulin resistance deserves particular attention. Healthy insulin signaling helps regulate glucose metabolism, fat storage, and hepatic lipid processing. However, chronically excessive energy intake and increasing visceral fat can disrupt this signaling. Genetics, inactivity, sleep disruption, and several medical conditions can contribute further. Adipose tissue then releases more free fatty acids into circulation. Many of those fatty acids travel directly toward the liver. The liver must process this growing energy supply while continuing its other metabolic responsibilities.
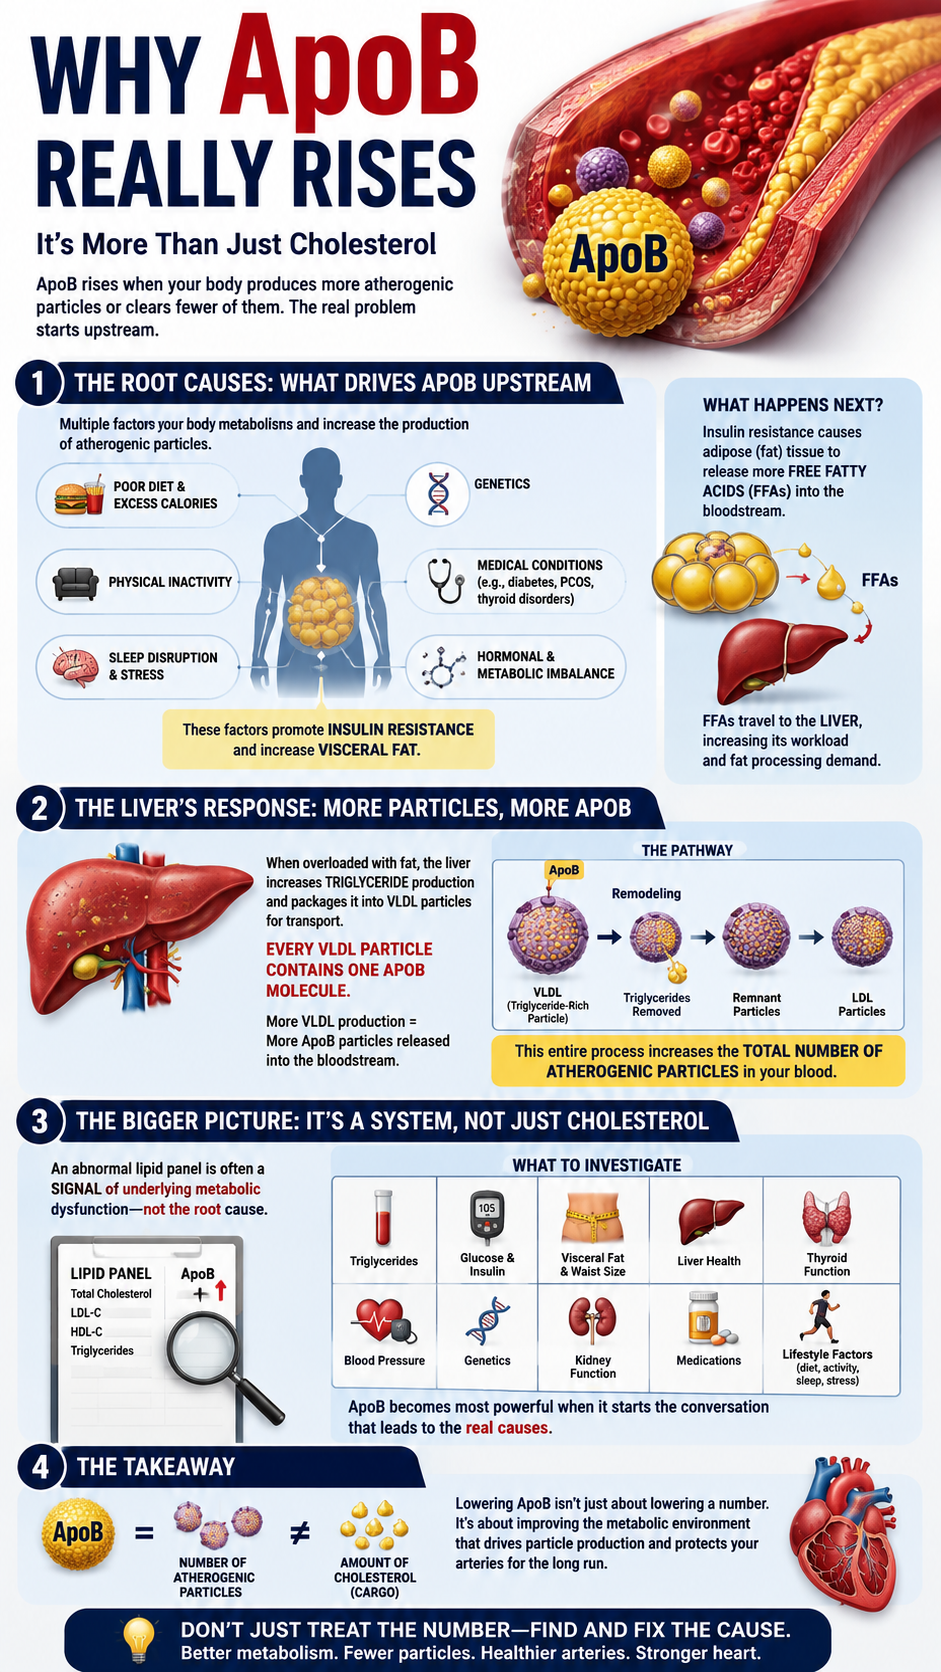
Hepatic triglyceride production can rise under these conditions. The liver packages triglycerides into VLDL particles for transportation through the bloodstream. Every VLDL particle contains ApoB. Therefore, increased VLDL particle production can increase the total number of ApoB-containing particles entering circulation. Those particles subsequently undergo remodeling as triglycerides are removed. Remnant particles and LDL particles emerge during this process. What appears on a cholesterol panel represents the downstream footprint of a much larger metabolic system.
This explains an important cardiovascular principle. Sometimes an abnormal lipid profile represents a symptom of metabolic dysfunction rather than an isolated cholesterol disorder. Treating the laboratory value without investigating its metabolic setting can leave important drivers untouched. A comprehensive assessment therefore asks about triglycerides, glucose regulation, visceral fat, liver health, thyroid function, blood pressure, genetics, kidney function, medications, and lifestyle. ApoB becomes more useful when it starts an investigation rather than ending one.
Insulin Resistance Changes the Lipoprotein Landscape
Insulin resistance can reshape lipoprotein metabolism long before fasting glucose reaches diabetic levels. The pancreas often compensates by producing additional insulin. Blood glucose may remain deceptively normal during this compensation. Meanwhile, hepatic lipid metabolism can already be changing. Triglycerides may rise, HDL-C may fall, and LDL particle composition may shift. Standard glucose testing alone can therefore miss important metabolic deterioration.
Triglyceride-rich VLDL particles participate in exchanges with LDL and HDL particles. Cholesteryl ester transfer protein helps move triglycerides and cholesterol esters between lipoproteins. Hepatic lipase subsequently remodels triglyceride-enriched LDL particles. Smaller, cholesterol-depleted LDL particles can result. Consequently, someone may accumulate many LDL particles without developing an equally dramatic LDL-C elevation.
This is one reason ApoB becomes particularly informative in hypertriglyceridemia and insulin-resistant states. The cholesterol content of each particle becomes less predictable. Measuring cargo alone therefore provides less information about particle number. ApoB cuts through some of that uncertainty because each atherogenic particle contributes one ApoB molecule to the measurement.
Small dense LDL often receives the blame during these discussions. However, focusing exclusively on particle size can miss the broader metabolic picture. Small LDL frequently appears alongside elevated triglycerides, insulin resistance, visceral obesity, and hepatic lipid abnormalities. The particle pattern can therefore function as a metabolic warning signal. Rather than fearing one LDL subtype, investigate the physiology producing the entire pattern.
What Too Many ApoB Particles Can Do Inside the Arteries
Atherosclerosis begins years before chest pain, heart attacks, or abnormal stress tests appear. ApoB-containing particles repeatedly circulate past an enormous endothelial surface. Some enter the arterial intima. Particle entry alone does not guarantee plaque formation. Retention within the arterial wall represents a crucial step. Interactions between ApoB-containing particles and arterial proteoglycans can trap lipoproteins within the intima.
Retained particles can undergo oxidative and enzymatic modification. The arterial environment then begins changing. Endothelial cells express adhesion molecules and inflammatory signals. Circulating monocytes migrate into arterial tissue and become macrophages. Those macrophages consume modified lipoproteins and accumulate lipid. Eventually, they can transform into foam cells, creating one of the earliest recognizable features of atherosclerotic plaque.
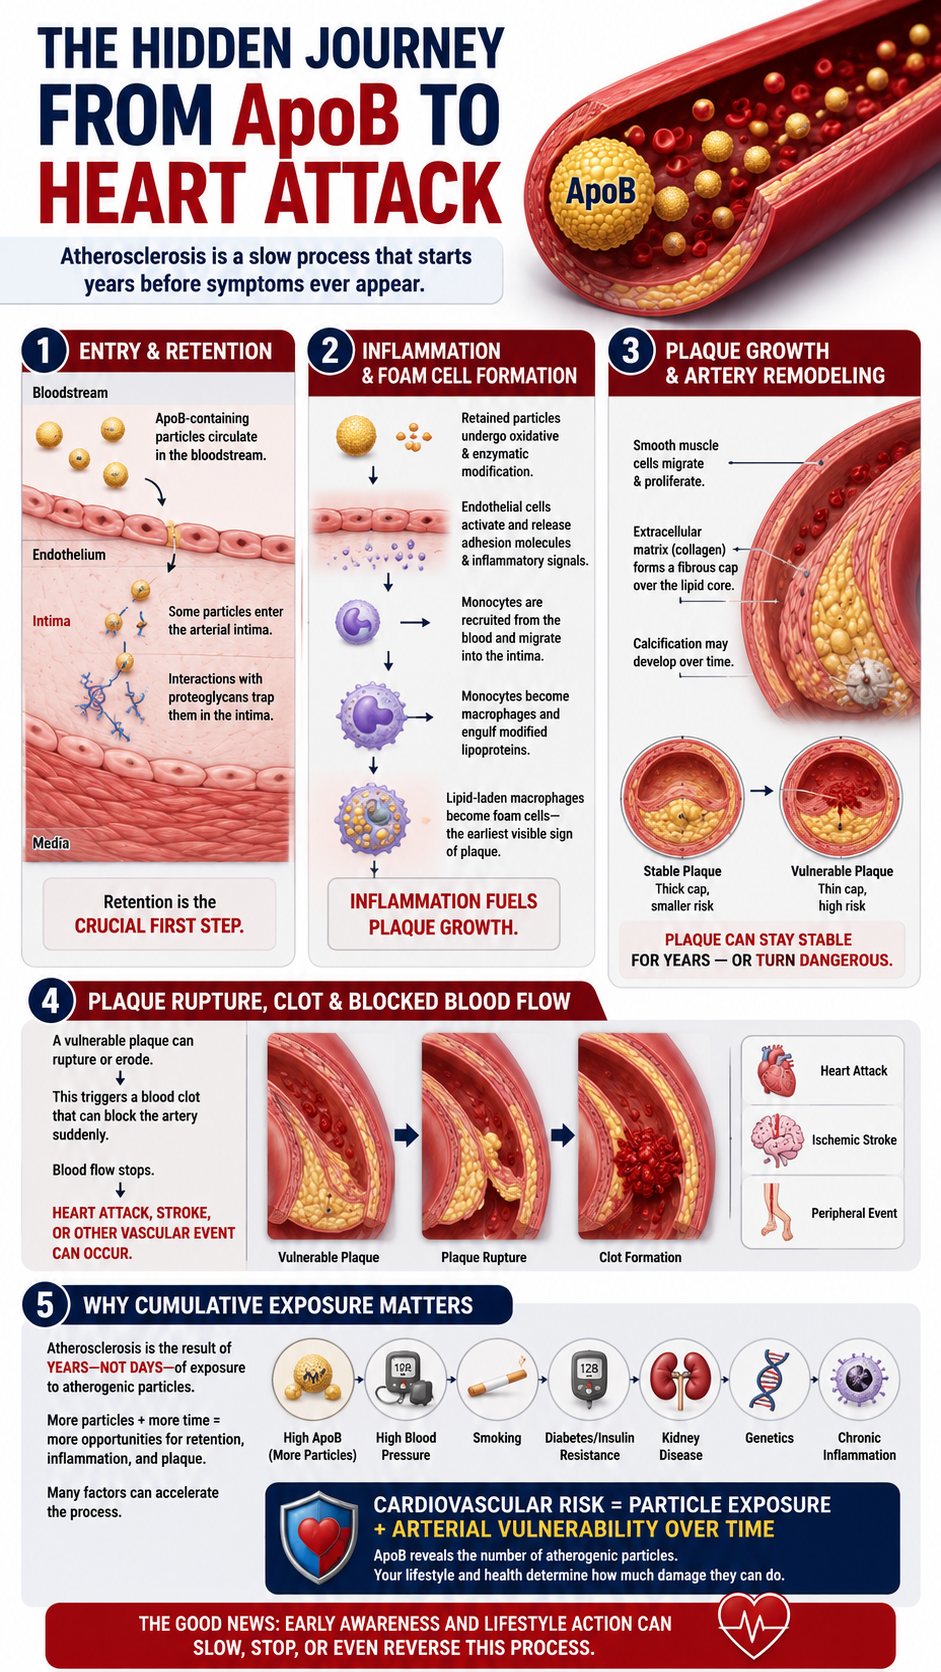
As this process continues, the artery attempts repair. Smooth muscle cells migrate and proliferate while extracellular matrix develops around the lesion. A fibrous cap can form over an expanding lipid-rich core. Calcification may eventually appear as the disease progresses. Some plaques remain relatively stable for years. Others become vulnerable to rupture or erosion. When a disrupted plaque triggers clot formation, blood flow can suddenly stop. The result may be myocardial infarction, ischemic stroke, or another acute vascular event.
This progression explains why cumulative exposure matters tremendously. One elevated ApoB result does not create atherosclerosis overnight. Years of elevated particle concentrations increase opportunities for arterial retention. Blood pressure, smoking, diabetes, kidney disease, genetics, and inflammatory conditions can amplify that environment. Cardiovascular risk therefore reflects both particle exposure and the vulnerability of the vascular terrain.
ApoB, LDL-C, and the Dangerous Illusion of a “Normal” Result
Modern medicine loves reference ranges because they simplify complicated biology. Unfortunately, a laboratory range cannot determine whether an individual artery contains plaque. Nor can one cholesterol result reconstruct decades of metabolic exposure. Someone may celebrate an LDL-C value that falls inside a laboratory range while carrying elevated ApoB. Another person may have elevated LDL-C but fewer particles than expected. Context determines what those numbers mean.
The 2026 ACC/AHA dyslipidemia guideline reflects this growing sophistication. ApoB measurement now receives specific consideration when cardiovascular risk remains uncertain. It becomes particularly relevant for people with elevated triglycerides, diabetes, or cardiometabolic disease. These conditions frequently create LDL-C and ApoB discordance. The guideline also recognizes Lp(a), non-HDL cholesterol, and coronary artery calcium as valuable tools within broader risk assessment.
A better cardiovascular evaluation therefore resembles an investigation rather than a cholesterol verdict. LDL-C provides useful evidence. ApoB adds particle information. Triglycerides expose another dimension of lipid transport. Lp(a) can reveal inherited risk. Glucose and insulin markers illuminate metabolic function. Blood pressure measures another powerful vascular stress. Coronary calcium can demonstrate established calcified plaque. Each finding answers a different question about the same cardiovascular system.
That leads to the central conclusion of Part One. ApoB can outperform LDL cholesterol when particle number and cholesterol content become discordant. Yet the most important discovery lies beyond the comparison itself. Elevated ApoB often represents the downstream expression of deeper metabolic, genetic, or physiological forces. Understanding those forces creates the foundation for meaningful cardiovascular prevention.
ApoB Should Open the Investigation, Not Close It
Receiving an elevated ApoB result should trigger curiosity rather than panic. The number tells us that atherogenic particle concentration deserves attention. However, it cannot explain the entire cause. Genetics may dominate one person’s pattern. Insulin resistance may dominate another person’s results. Hypothyroidism, kidney disease, medications, obesity, or metabolic liver disease can contribute in others. Several factors often operate simultaneously.
Start by examining the complete lipid pattern. Triglycerides provide valuable information about triglyceride-rich lipoprotein metabolism. Non-HDL cholesterol captures cholesterol within multiple atherogenic particle classes. HDL-C adds context, although a high HDL number does not guarantee cardiovascular protection. Lp(a) deserves measurement because genetically elevated levels can substantially modify cardiovascular risk. ApoB then helps estimate the combined concentration of atherogenic particles.
Next, investigate glucose regulation. Fasting glucose and HbA1c remain useful, but they should not automatically define metabolic health. Compensatory hyperinsulinemia can precede overt hyperglycemia. Fasting insulin may therefore provide additional information in selected patients. Triglycerides, waist circumference, blood pressure, liver markers, and body composition add further context. Together, these findings can reveal metabolic deterioration that one glucose measurement misses.
The Liver Sits at the Center of Lipoprotein Traffic
The liver deserves special attention because it regulates lipoprotein production and clearance. Excess energy, visceral fat, insulin resistance, alcohol, genetics, and several diseases can alter hepatic lipid handling. Increased fatty-acid delivery can encourage triglyceride synthesis and VLDL secretion. Because each VLDL particle carries ApoB, increased secretion can raise atherogenic particle burden.
Metabolic dysfunction-associated steatotic liver disease often travels with this pattern. Fat accumulates inside liver cells while insulin resistance and abnormal lipid trafficking worsen. Liver enzymes can remain within laboratory ranges despite significant hepatic fat. Therefore, normal ALT and AST values cannot always exclude metabolic liver dysfunction. Clinical history, metabolic markers, imaging, and appropriate scoring tools may provide additional information.
Improving liver metabolism does not require mysterious detoxification rituals. The liver already possesses sophisticated detoxification and metabolic systems. Reducing metabolic overload can support those systems more meaningfully. Losing excess visceral fat, improving insulin sensitivity, limiting alcohol, increasing movement, and improving food quality can reduce hepatic fat in many people. These changes may also improve triglycerides and the broader lipoprotein profile.
Thyroid Function, Genetics, and Other Overlooked Drivers
Thyroid physiology also influences cholesterol metabolism. Thyroid hormones affect LDL receptor expression and hepatic lipid handling. Untreated hypothyroidism can therefore elevate LDL-C and ApoB in some individuals. Anyone with an unexplained deterioration in lipid markers deserves appropriate thyroid assessment. Treating a secondary cause can sometimes improve the lipid profile substantially.
Genetics can exert an even stronger influence. Familial hypercholesterolemia impairs LDL clearance and can create lifelong exposure to high concentrations of atherogenic particles. Elevated Lp(a) is also largely genetically determined. Lifestyle remains important for overall cardiovascular health, but lifestyle alone may not normalize genetically driven lipoprotein abnormalities. Recognizing that distinction prevents misplaced confidence and allows risk to be addressed appropriately.
Kidney disease, certain medications, hormonal changes, and other medical conditions can also alter lipid metabolism. That complexity explains why one universal “ApoB diet” makes little biological sense. Two people can share an identical ApoB result while reaching it through different pathways. Effective prevention begins by identifying which pathways actually apply.
The At-Home Strategy: Rebuild Metabolic Health From the Ground Up
The most powerful home strategy begins with food quality rather than obsessive cholesterol counting. Remove the foods that encourage overeating and metabolic dysfunction. Refined sugars, sugar-sweetened beverages, and heavily processed foods deserve particular attention. Highly refined carbohydrates can also worsen triglycerides in susceptible individuals. Whole-food meals make energy intake and appetite regulation easier for many people.
Build meals around adequate protein and minimally processed foods. Protein supports muscle maintenance, satiety, and recovery. Vegetables, herbs, and other fiber-rich foods can support dietary quality when tolerated. Fat quality also matters, especially when ApoB remains elevated. Replacing substantial amounts of saturated fat with unsaturated fats can lower LDL-C and ApoB in many individuals. Olive oil, avocado, seeds, nuts, and fatty fish provide useful options when appropriate.
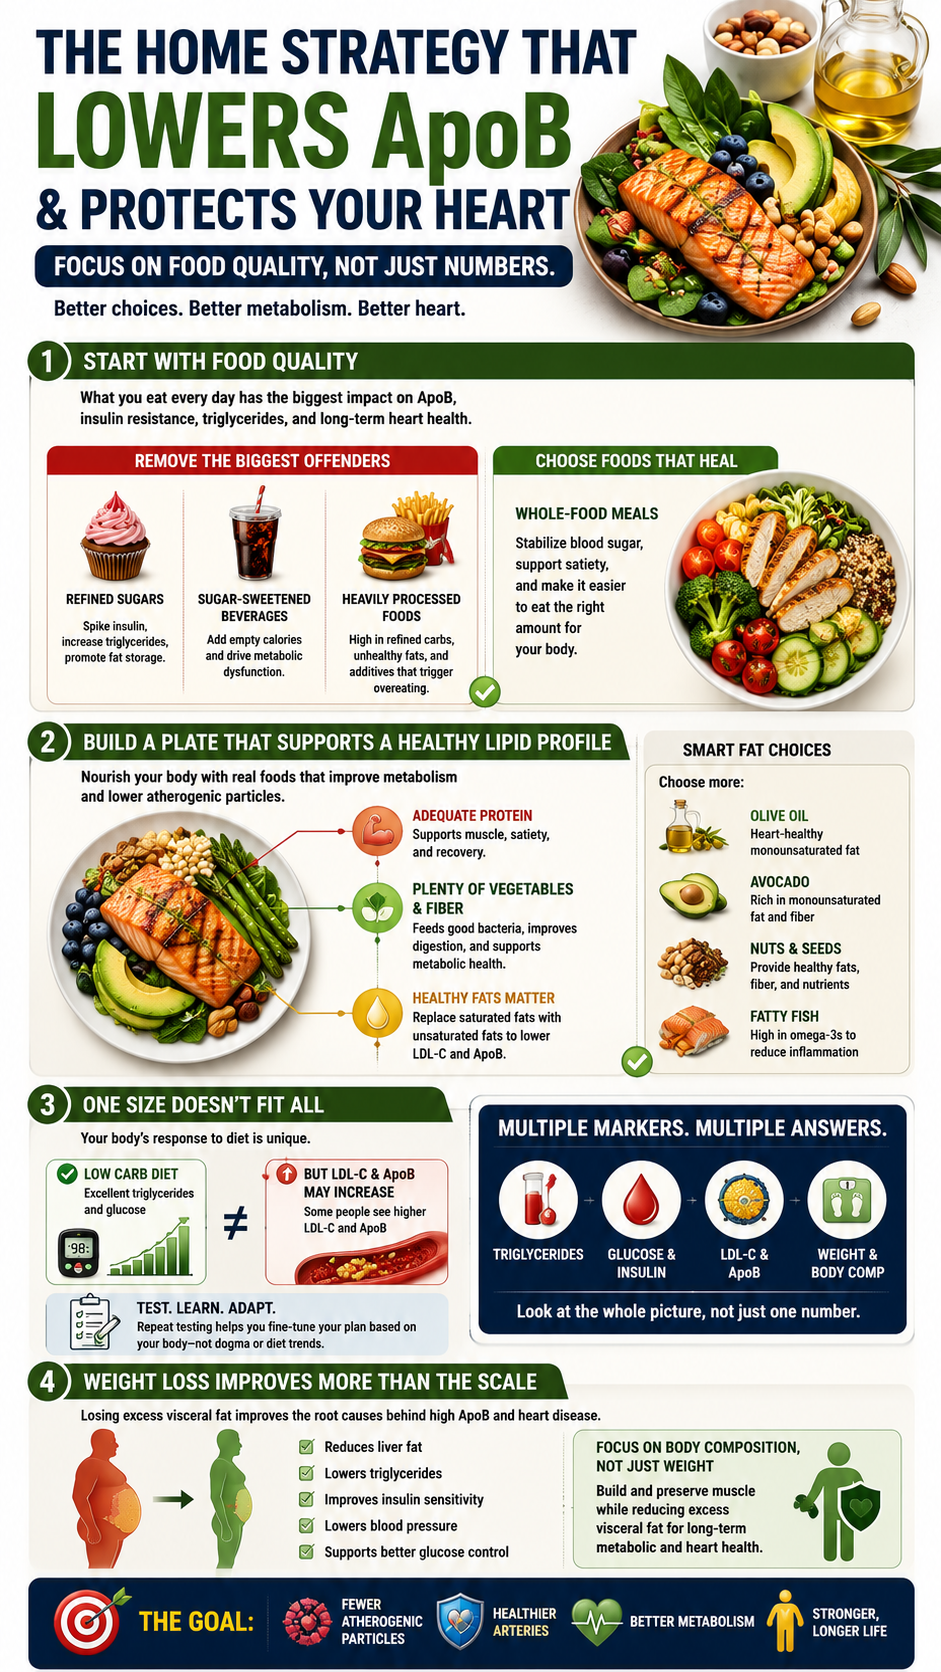
Dietary response varies considerably between individuals. Someone eating a very-low-carbohydrate diet can experience excellent triglycerides and glucose while developing a major LDL-C and ApoB increase. That result should not automatically be dismissed because other metabolic markers improved. Cardiovascular physiology contains multiple dimensions. Repeat testing allows dietary choices to follow actual biological responses rather than dietary ideology.
Weight loss can become particularly valuable when visceral adiposity and insulin resistance are present. Even moderate reductions in body weight can improve liver fat, triglycerides, glucose regulation, and blood pressure. The goal should involve improving body composition rather than chasing a smaller scale number. Preserving muscle while reducing excess visceral fat creates a much healthier metabolic environment.
Muscle Is an Underused Cardiovascular Organ
Skeletal muscle performs far more than mechanical movement. It serves as a major site for glucose disposal and contributes substantially to insulin sensitivity. Maintaining muscle becomes increasingly important with age because sarcopenia can worsen metabolic health. Resistance exercise therefore belongs inside a serious cardiovascular prevention strategy.
Training does not require living inside a gym. Two or three well-designed resistance sessions each week can create meaningful adaptations. Squats, hinges, pushes, pulls, carries, and other functional movements can train major muscle groups efficiently. Exercise selection should match physical ability, orthopedic health, and experience. Progressive overload encourages the body to maintain or build metabolically active tissue.
Walking provides another remarkably accessible intervention. Post-meal walking can reduce postprandial glucose excursions and increase muscle glucose uptake. Daily movement also helps break prolonged sedentary periods. Aerobic exercise adds improvements in cardiorespiratory fitness, blood pressure, and insulin sensitivity. Combining resistance training, regular walking, and aerobic conditioning creates broader benefits than relying on one exercise style.
Sleep and Stress Belong in the Cardiovascular Conversation
Sleep deprivation changes metabolic physiology. Insufficient sleep can impair insulin sensitivity, increase hunger, alter appetite hormones, and raise sympathetic nervous activity. Chronic sleep problems can also worsen blood pressure. Someone eating perfectly while sleeping five hours nightly may still struggle metabolically.
Aim for consistent sleep and wake times whenever possible. Most adults require approximately seven to nine hours nightly. Darkening the bedroom, reducing late-night light exposure, and avoiding heavy meals immediately before sleep can help. Persistent snoring, witnessed breathing pauses, morning headaches, or severe daytime sleepiness deserve further evaluation. Obstructive sleep apnea carries meaningful cardiometabolic consequences.
Chronic psychological stress also influences cardiovascular physiology through autonomic and hormonal pathways. Stress management should not become another vague wellness slogan. Daily sunlight exposure, exercise, social connection, prayer, meditation, controlled breathing, and time outdoors can help regulate stress responses. The best strategy is one someone can practice consistently.
Measure Whether the Strategy Is Actually Working
Lifestyle changes should produce measurable biological improvements. Repeat testing can show whether ApoB, triglycerides, glucose regulation, blood pressure, and other markers are moving favorably. Guessing provides less information than measuring. An intervention that sounds healthy may not produce the expected response in every individual.
A useful follow-up interval depends on the intervention and clinical situation. Many lipid changes become visible within several weeks to months. ApoB can then be compared with LDL-C, non-HDL-C, and triglycerides. Body composition, waist circumference, blood pressure, fasting glucose, and HbA1c can provide additional feedback. Selected individuals may benefit from fasting insulin or other metabolic assessments.
Lp(a) generally requires a different mindset because levels are largely genetically determined. The 2026 ACC/AHA guideline recommends measuring Lp(a) at least once during adulthood. Someone with substantially elevated Lp(a) may need more aggressive management of modifiable cardiovascular risks. Knowing about inherited risk early creates opportunities that ignorance cannot provide.
Coronary artery calcium testing can add another dimension when appropriate. ApoB estimates exposure to atherogenic particles, while CAC identifies calcified coronary plaque. The two tests therefore answer different questions. A zero CAC score does not erase lifelong ApoB exposure or exclude noncalcified plaque. An elevated CAC score indicates established calcified coronary atherosclerosis and deserves careful risk assessment.
ApoB Versus LDL Cholesterol: The Verdict
So, is ApoB a better cardiovascular risk marker than LDL cholesterol? In many situations, especially during discordance, ApoB provides information that LDL-C cannot. LDL cholesterol measures the cholesterol carried within LDL particles. ApoB estimates the number of circulating atherogenic particles. When particles become cholesterol-depleted, LDL-C can underestimate their concentration. ApoB can reveal that hidden burden.
However, replacing LDL obsession with ApoB obsession would repeat the same mistake under a different name. Neither marker explains the entire cardiovascular system. ApoB does not measure blood pressure, insulin resistance, smoking damage, coronary plaque, or inflammatory disease. It cannot determine someone’s complete cardiovascular future. Instead, ApoB strengthens the investigation by revealing particle burden.
The most sophisticated approach combines markers with physiology. Examine LDL-C, ApoB, triglycerides, non-HDL cholesterol, and Lp(a). Investigate glucose regulation, visceral adiposity, liver health, thyroid function, blood pressure, smoking exposure, sleep, and physical activity. Consider coronary imaging when clinically appropriate. Then ask what connects the abnormal findings.
That final question matters more than any isolated laboratory number.
The Number Is a Clue; The Biology Is the Story
Cardiovascular disease rarely begins on the morning someone receives an abnormal blood test. The biological story usually started years earlier. Insulin sensitivity may have slowly declined. Visceral fat may have accumulated. Hepatic lipid traffic may have changed. Blood pressure may have risen quietly. Genetic susceptibility may have accelerated particle exposure. ApoB-containing particles may have repeatedly encountered vulnerable arterial tissue throughout those years.
Eventually, the laboratory report catches a glimpse of that story.
ApoB represents an important advance because it asks a better question than LDL cholesterol alone. Instead of measuring only cholesterol cargo, it estimates how many atherogenic particles carry that cargo. That distinction becomes especially valuable when metabolic dysfunction creates numerous cholesterol-depleted particles. The apparently acceptable LDL-C result may then conceal a higher particle burden.
Yet the greatest value of ApoB appears when we refuse to stop at ApoB. Trace abnormal particle production back toward metabolic health. Examine insulin signaling, liver metabolism, visceral fat, thyroid physiology, genetics, diet, movement, sleep, and blood pressure. Determine whether inherited Lp(a) risk exists. Look for evidence of established atherosclerosis when appropriate. Then build an individualized strategy around what the investigation reveals.
The future of cardiovascular prevention should move beyond labeling cholesterol as simply “good” or “bad.” Human lipid physiology deserves more respect than those outdated slogans allow. LDL-C remains valuable, but it cannot count every atherogenic particle. ApoB fills an important gap, while metabolic and vascular assessment fills several others.
Your cholesterol number is not your cardiovascular destiny. Neither is your ApoB.
Both are clues.
The real story lies in the biological environment that produced those numbers, the cumulative exposure your arteries have experienced, and the actions taken next. Once those pieces come together, cardiovascular testing becomes more than disease prediction. It becomes a map showing where physiology has drifted and where meaningful change can begin.